
 |
1st Floor, Kaselehlie Building, National Government Comples, Palikir, Pohnpei | |||||
|
P. O. Box PS 12 Palikir, Pohnpei Federated States of Micronesia 96941 |
Telephone: (691) 320 2646/5133/2620 Fax No.: (691) 320 5854 E-mail: This email address is being protected from spambots. You need JavaScript enabled to view it. Website: www.fsmstats.fm |
|||||
| STATISTICAL NEWS | ||||||
|
FSMDS Release No: 24.01 |
|
25 January 2024 |
|
Consumer Price Index Statistics |
||
|
 This release gives information on changes in the Consumer Price Index (CPI) for the Federated States of Micronesia (FSM) and the four states - Chuuk, Kosrae, Pohnpei and Yap. Appendix 1 contains tables with detailed data for FSM and the four states. This release gives information on changes in the Consumer Price Index (CPI) for the Federated States of Micronesia (FSM) and the four states - Chuuk, Kosrae, Pohnpei and Yap. Appendix 1 contains tables with detailed data for FSM and the four states.
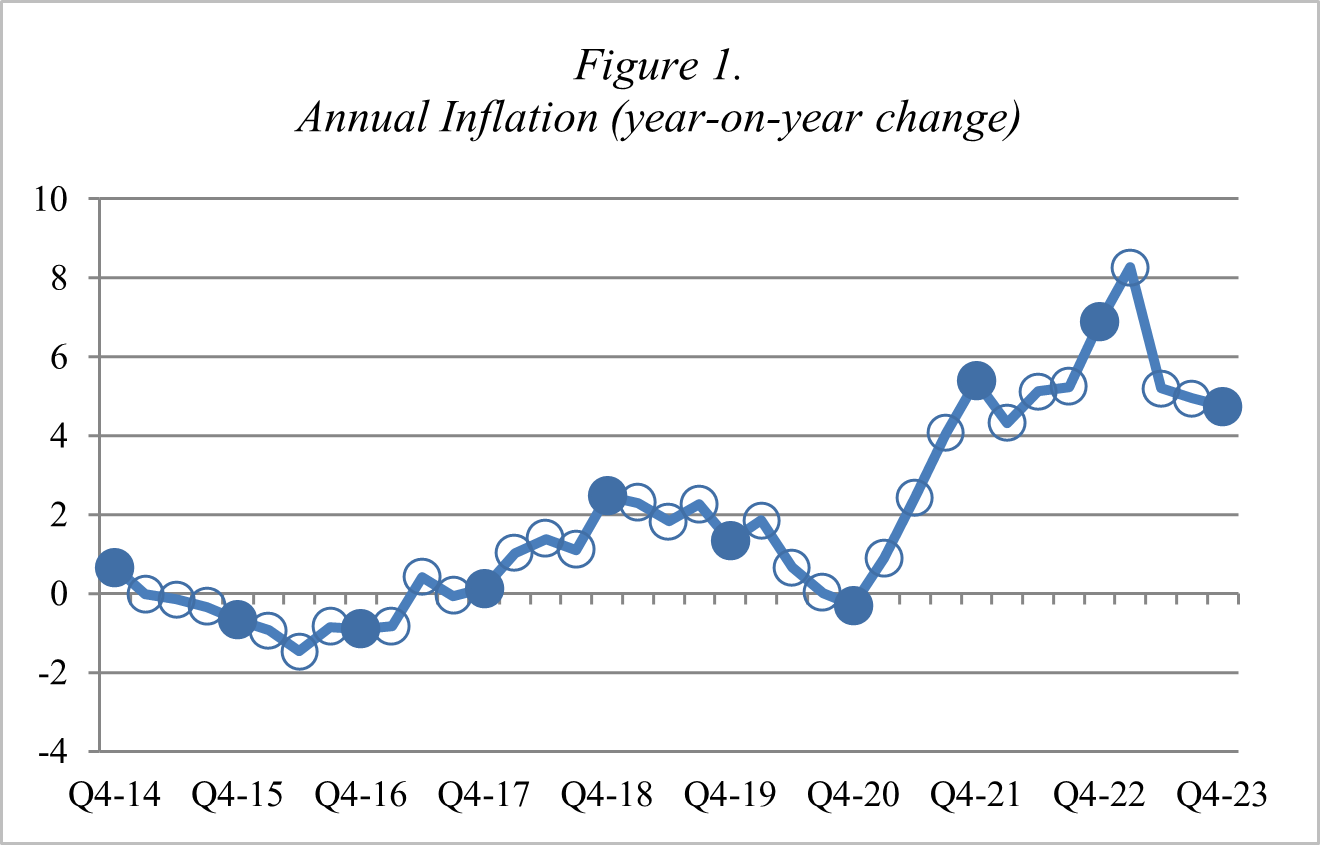
Annual Inflation
The annual inflation in the 4th quarter of 2023 was 4.7% for All Groups. In the same quarter of the previous year (2022) the rate was 6.5%, indicating a decrease of 1.8 percentage points (Figure 1).
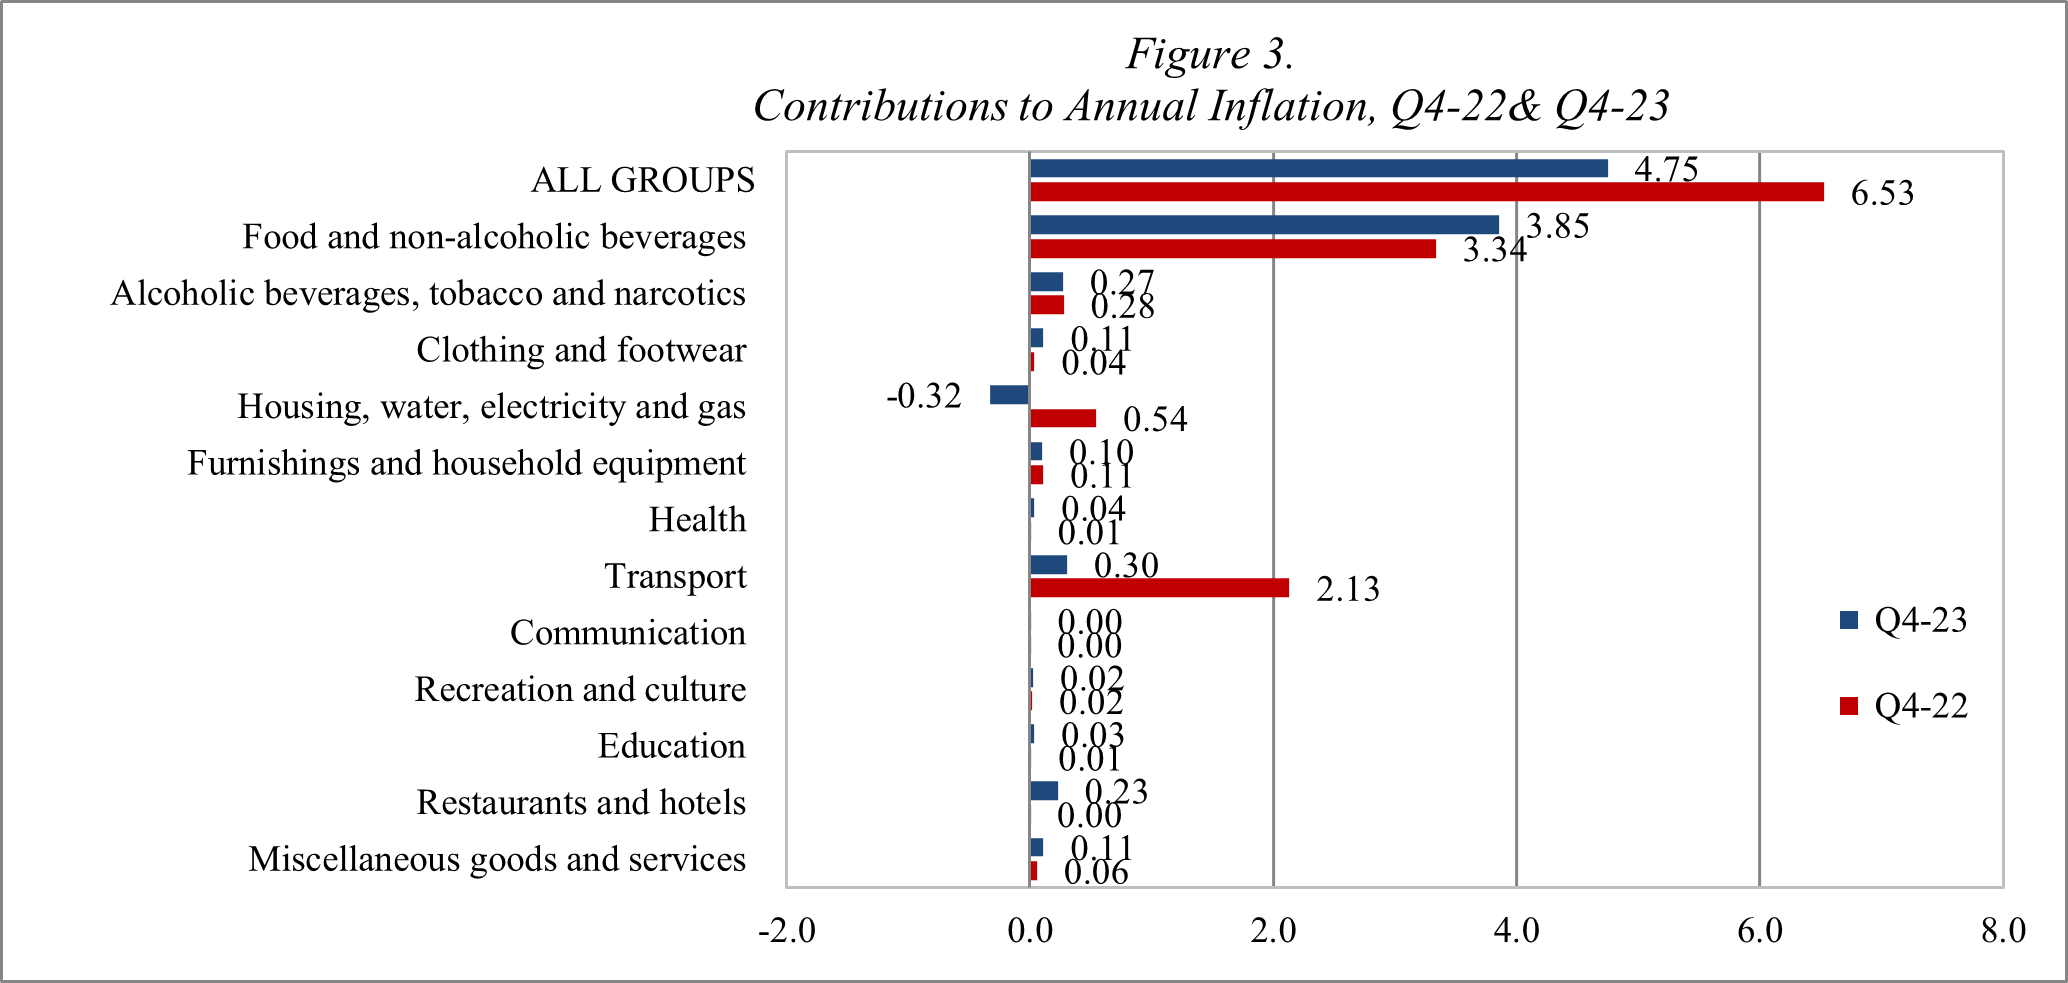
The largest contributions to the annual inflation for 4th quarter 2023 came from the Food and non-alcoholic beverage division, which increased in prices by 9.2%.(Figure 3).
Annual inflation differs by state .The highest inflation rate that was recorded in this quarter came from Kosrae at 6.6%, followed by Chuuk at 6.0%, Yap at 4.2% and Pohnpei at 3.9%.
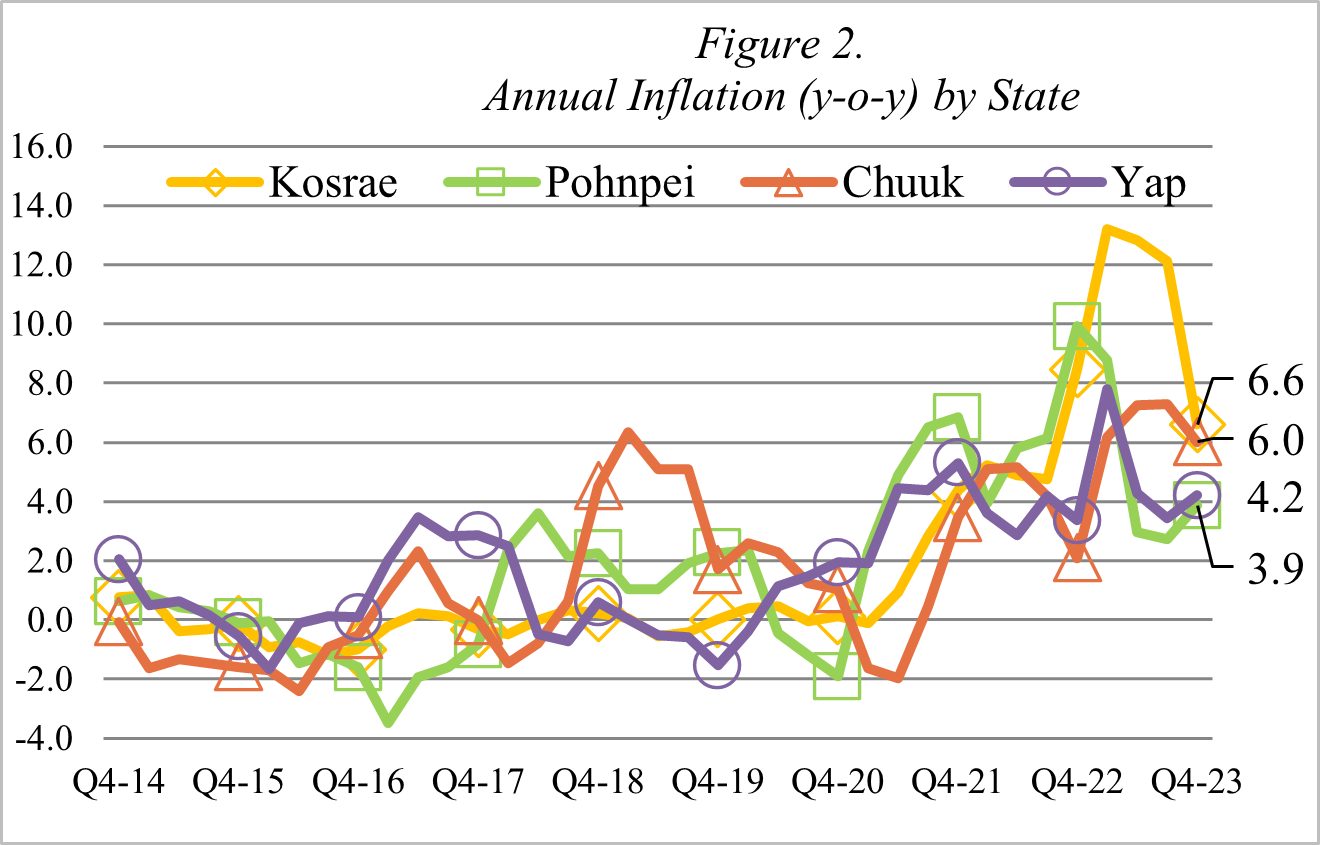 The high inflation rate in Kosrae appears to be caused by the increasing prices for the Transport division, which was recorded at 21.4%. Wheeras, in Pohnpei, Chuuk and Yap the inflation rates were driven by the increasing prices in the Food and non-alcoholic division, which recorded at 10.4%, 14.8%, and at 10.2%, respectively. The high inflation rate in Kosrae appears to be caused by the increasing prices for the Transport division, which was recorded at 21.4%. Wheeras, in Pohnpei, Chuuk and Yap the inflation rates were driven by the increasing prices in the Food and non-alcoholic division, which recorded at 10.4%, 14.8%, and at 10.2%, respectively.
Contributions to inflation
The details of the price changes are presented here, comparing the changes between 2022 and 2023 (Figure 3) and the items/products driving these changes (Figure 4).
 |
||
Figure 4.
Contribution to Annual Inflation, Q4-23
| Division | Annual Change | Comments: Items contributing to change |
| All Groups | 4.75% | Sum=All Groups % Change |
| Food and non-alcoholic beverages | 9.18% | Higher prices were recorded for bread, fresh tuna, reef fish, doughnuts, soft drinks, ketchup and taro. |
| Alcoholic beverages, tobacco and narcotics | 2.19% | Higher prices were recorded for betelnut, beer and liquor. |
| Clothing and footwear | 4.20% | Higher prices were recorded for blouses, laundromats, pants, t-shirts, local dresses and shirts. |
| Housing, water, electricity and gas | -2.12% | Lower prices were recorded for electricity |
| Furnishings and household equipment | 2.54% | Higher prices were recorded for batteries, towels, bleaches, tupperwares, fans, washing machines, and air conditioners. |
| Health | 5.16% | Higher prices were recorded for prescription medicine. |
| Transport | 2.18% | Higher prices were recorded for airfare, automobile services, and motor oil. |
| Communication | 0.10% | Higher prices of were recorded for cell phones. |
| Recreation and culture | 1.75% | Higher prices were recorded for notebooks. |
Appendix 1: Detailed tables
| Table 1 | Indexes by COICOP category and State |
| Table 2 | Quarterly changes by COICOP category and State |
| Table 3 | Annual changes by COICOP category and State |
| Table 4 | Quarterly contributions by COICOP category and State |
| Table 5 | Annual contributions by COICOP category and State |
/s/
Brihmer S. Johnson
Assistant Secretary for Statistics